Tag: charts
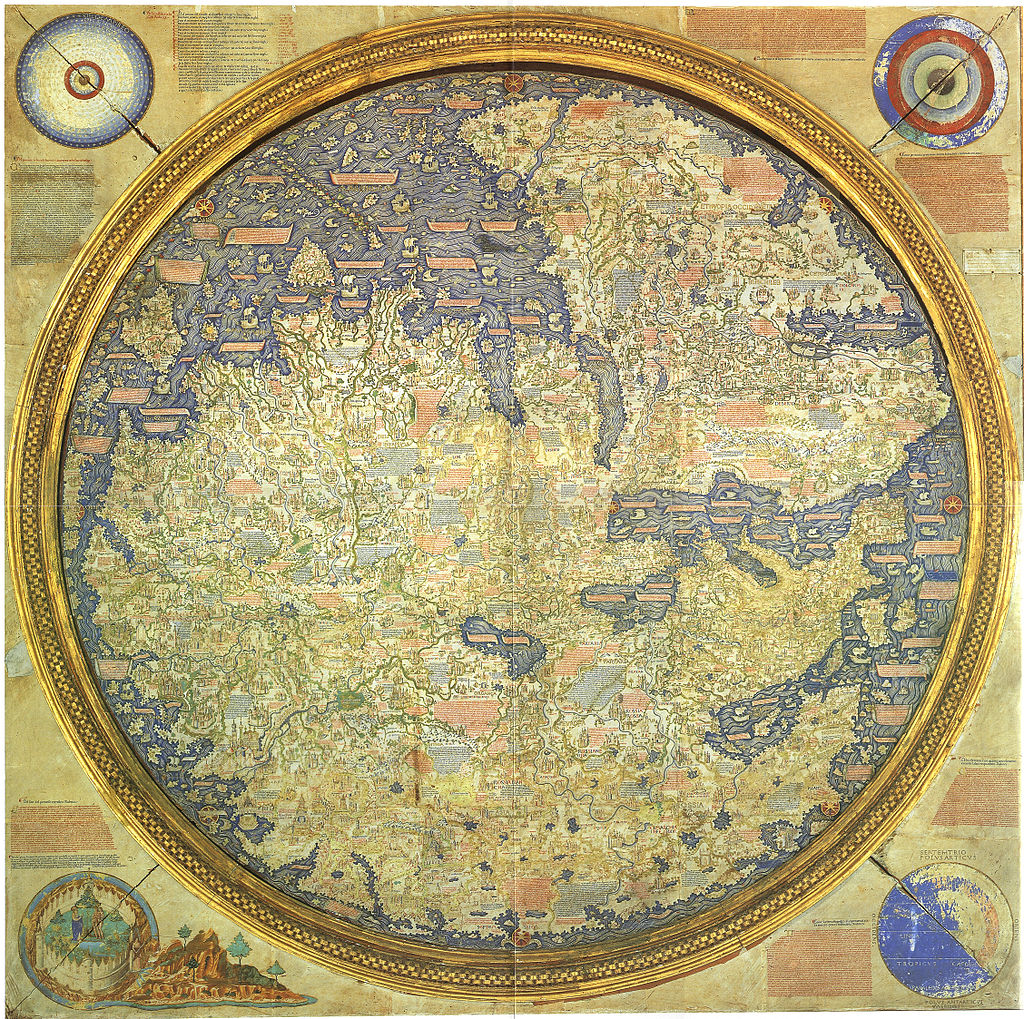
Here be Dragons
You have probably heard the expression, and most likely associate it with images of old maps covered in drawings of sea serpents and other mythological creatures. But what are exactly those creatures living on the margins, and how did they get there? Pack your bags and jump on board. But aware, though, for Here be Dragons. Despite its popularity, there ...
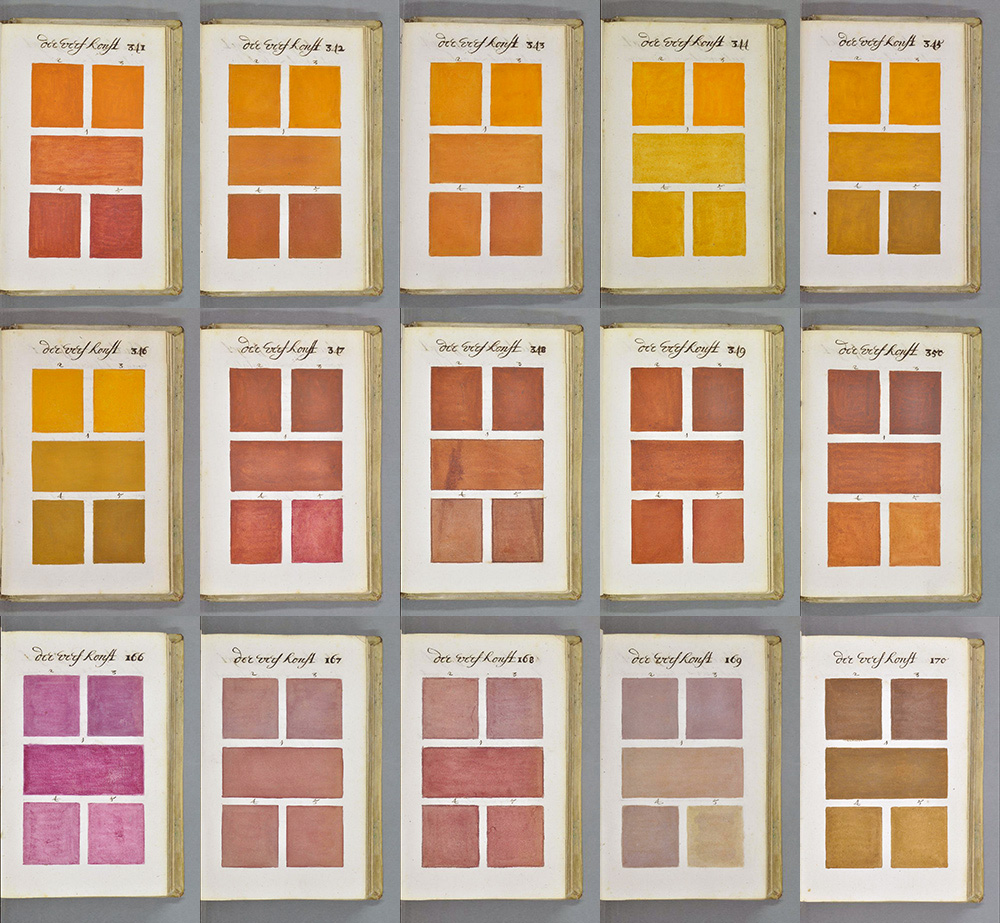
Colour guide anno 1692
A dutch artist – known only as A. Boogert – created a book of colour in 1692. Describing the use of colour in painting, s/he created an 800-page book with instructions on how to create hues and tones. It blows my mind, actually. The work, the meticulousness, the systematics, and not least: a book like that would ...

Dangerous tectonic visualisations
Dangerous tectonic visualisations: Visualisations are good things. They should be beautiful to look at, informative and invite discovery. But they can be very dangerous. Visualisations can be used to make decisions, learn something new, connect surprising dots, showing unknown connections. If you want to buy a car, you might find a visualisation that shows the ...

Charts: the horror of three dimensions
We have really cool tools to make information and data visible, I find joy in beautiful visualisation of complex information. I see, I learn. But here is what makes me furious: three-dimensional charts. Never, ever make diagrams and charts 3D. NEVER. Here is why: Graphs, diagrams and maps are tools to ask questions. Sometimes they are ...

David Rumsey collection: mapping history I
David Rumsey's gigantic collection of historical and modern maps, schematics, timelines, data visualisations, diagrams, history, time, sciences, religion is a never-ending source of wonder and inspirations. It is a bit of a trap, as I can spend days wandering around in the magical world of visualisations of history, science, culture, religion. Looking at the older ...
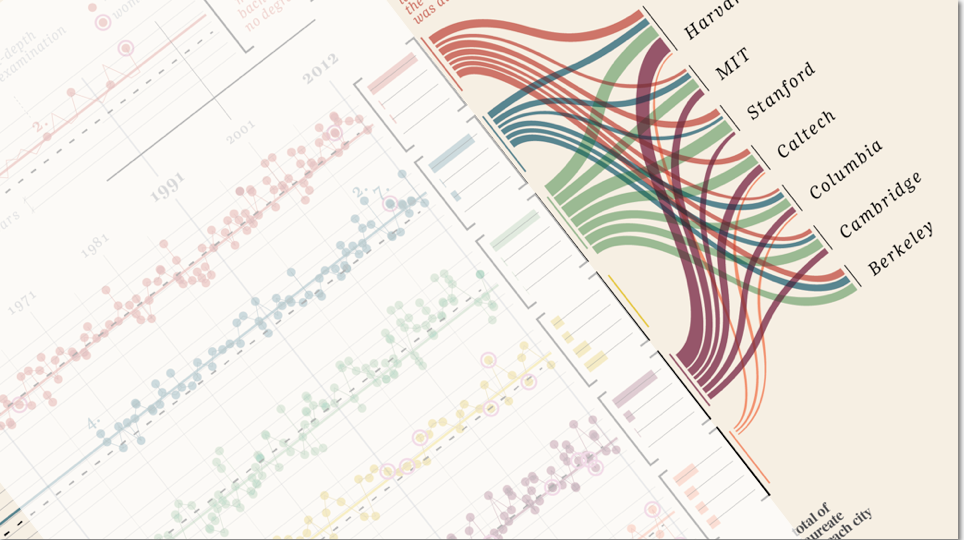
“Design is where science and art break even”
Once in a while I come across some images that takes my breath away, and make me intensely wish that I had thought about it myself. Art can of course do magic, but the combination of information and art, I feel, somehow takes both to a higher level. Giorgia Lupi Has made these amazing charts ...