Tag: Gephi

Visualising data, telling stories
Telling stories that can only be seen. Data visualisations can be extraordinarily beautiful. Here are but a few tools. gephi Open-source desktop application, primarily a network visualisation tool, but with plugins galore for space-time extensions. Gapminder Beautiful, multivariate statistics. See this phenomenal TED presentation by Hans Rosling - love that guy Google charts Not surprising, ...
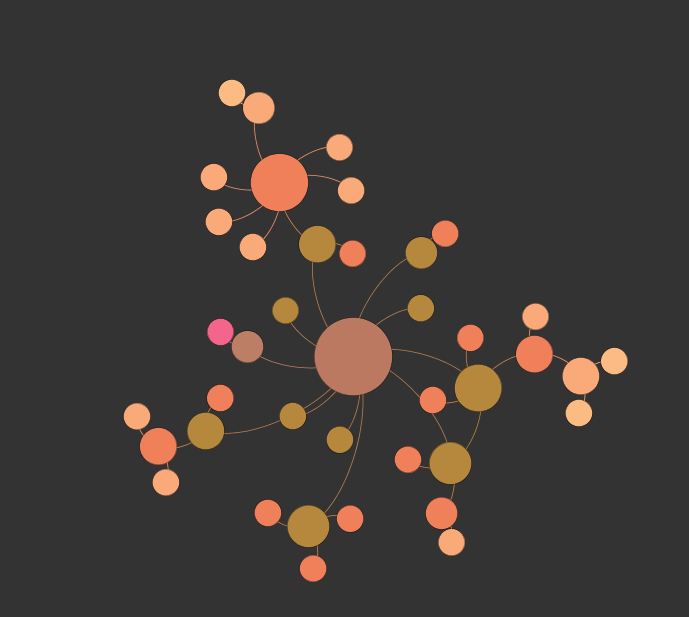
Life network
Take the things that are interesting, and see if you can connect the dots. This is made in Gephi, an open-source network visualisation tool. This will eventually be an interactive browser for my other blog ...