Tag: visualisations

Navigation – paddling the web
When we make websites for clients we analyse their business, their products, and their customers. We create interfaces that are logical, that helps drill down. I am looking to buy a notebook. This company sells stationary. A top-level category then might be "paper products", "writing and drawing", "blank paper" or something like that. So I ...
Doodling maths: Visualising prime numbers
Prime numbers are a cryptographer's dream: It's easy to take two very large prime numbers and multiply them, but it's extremely hard to do the opposite. There is no fast algorithm (yet) to factorize an integer into its prime factors, if you try to factor a large prime number you'll have to try every possible number between 2 ...
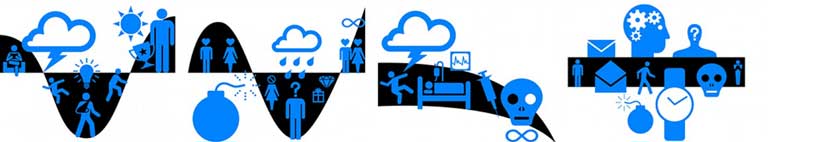
Kurt Vonnegut: the shape of stories
Been an avid reader of Kurt Vonnegut for a years. Magic, mad, brilliant. I found this visualisation by mayaeilam fascinating (though I would have liked to see the visuals more in the Vonnegutian tratdition of doodlyness, and not quite so sleek-ish). From now on, stories will not be the same... by mayaeilam ...
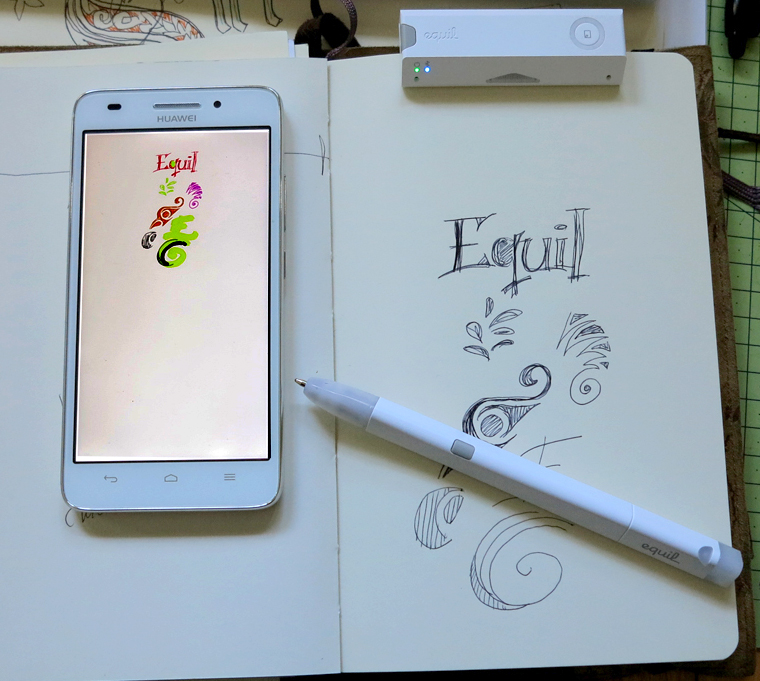
Equil smartpen2: phenomenal tool or novelty toy?
I am not into gadgets. The very word implies something useless; perhaps fun for a week, but quickly discarded. A pet hate of mine is the insane amount of electronics made, for stuff that do not need electronics. Waste of resources, batteries, minerals, human costs and filling up insane landfills with rubbish. Enter the Equil ...

A-maze
Listening to the QI No such thing as a fish podcast, I was alerted to the story of a Japanese girl, while clearing her caretaker-fathers stuff, found this amazing work. Apparently, he spent seven years doing this. I doff my hat. You can buy a print - more on this story here ...

Charts: the horror of three dimensions
We have really cool tools to make information and data visible, I find joy in beautiful visualisation of complex information. I see, I learn. But here is what makes me furious: three-dimensional charts. Never, ever make diagrams and charts 3D. NEVER. Here is why: Graphs, diagrams and maps are tools to ask questions. Sometimes they are ...
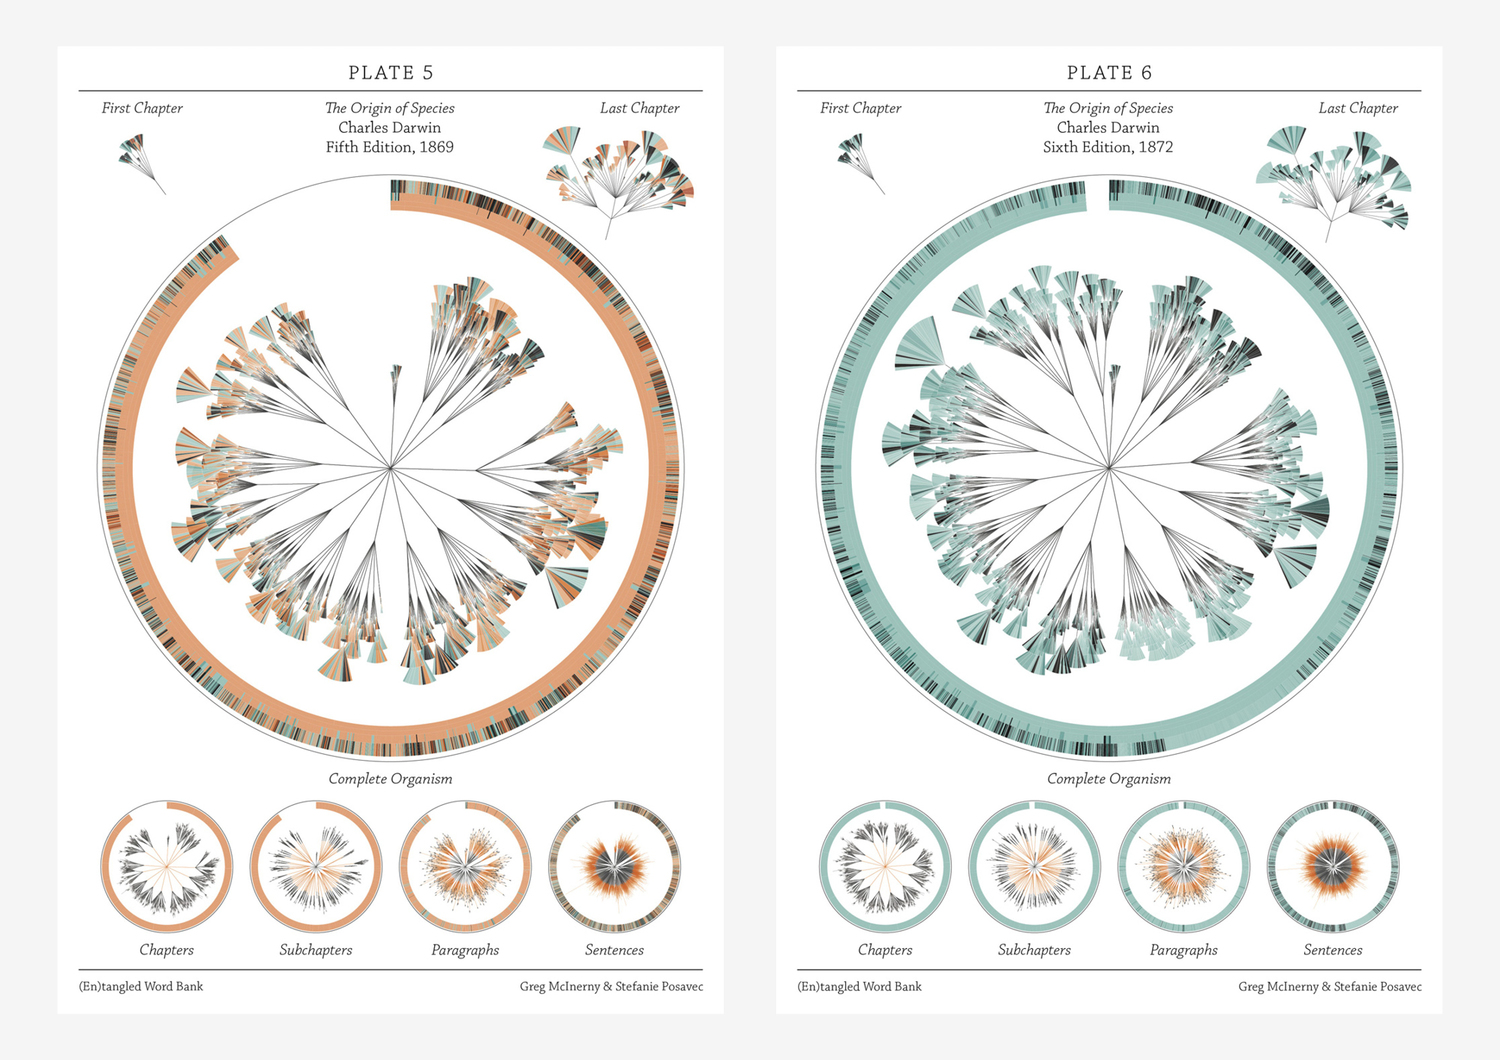
There is grandeur in this view of life – visualising Darwin
If I were to give an award for the single best idea anyone has ever had, I had to have to give it to Darwin, ahead of Newton and Einstein and everyone else. It is not just a wonderful scientific idea; it is a dangerous idea. it overthrows, or at least unsettles, some of the ...
Scalable geologic timeline II
For the geo-geeks out there, I have finished my geologic timescale brush; now better and more accurate than the previous one. Download the Illustrator file here Download .EPS file here Included is a swatch folder with all the colours as per the instructions of the International Commission on Stratigraphy: You are welcome to use this in ...

Fritz Kahn: the human as industrial palace
(I was horrified to discover that Wikipedia does not have an entry on Fritz Kahn in English. I was utterly unaware of how deep into obscurity this multitalented man had fallen. Update: my pigheaded ability to pester strangers have resulted in an solid entry on Kahn on Wikipedia. Many thanks to Yngvadottir ). man as ...
Ernst Haeckel: art and science through the microscope
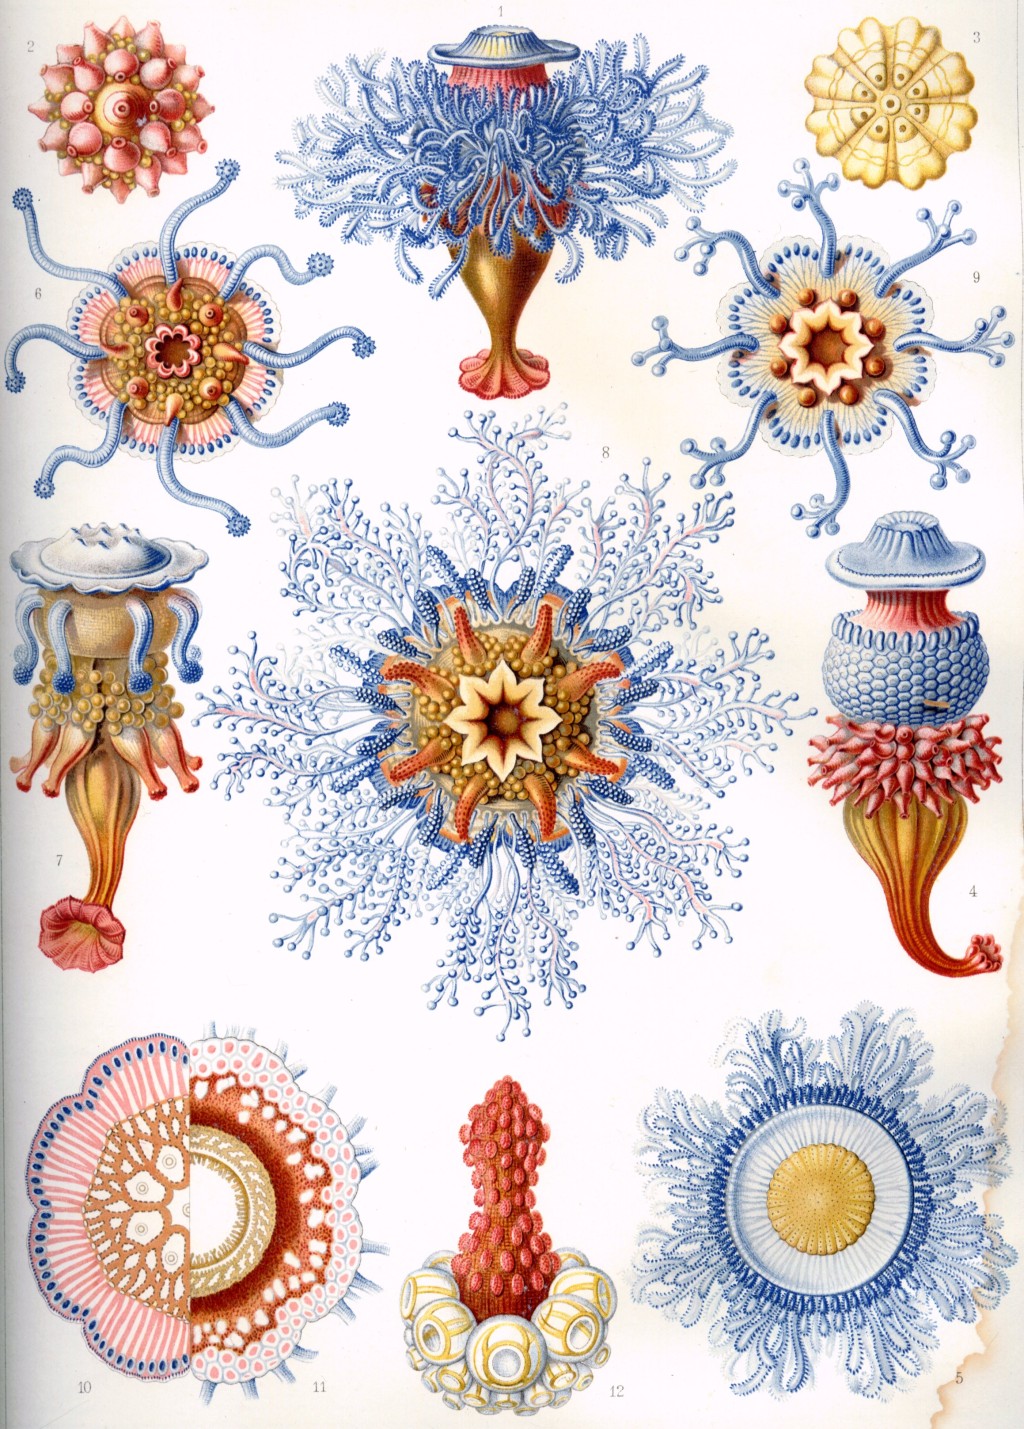
Ernst Haeckel Ernst Haeckel (1834 – 1919) was what we call a renaissance man. He was a professor, biologist, philosopher, physician, naturalist and artist. His contribution to biology, evolutionary theory and art is still mind-boggling; we owe a great deal of biological understanding and terminology to him. He was a great promoter of Darwin's theory ...

Smarties and the shape of the earth
The sphere is, according to Wikipedia, a reasonably correct model for earth. But mathematically the earth is an oblate spheroid. An example of that would be smarties and M&Ms, spheres squished at the poles. As a result of gravitation and the rotation of earth, it is about 21 km longer than the Earth’s polar radius. This is, of course, ...
Visual Italian Wikipedia use
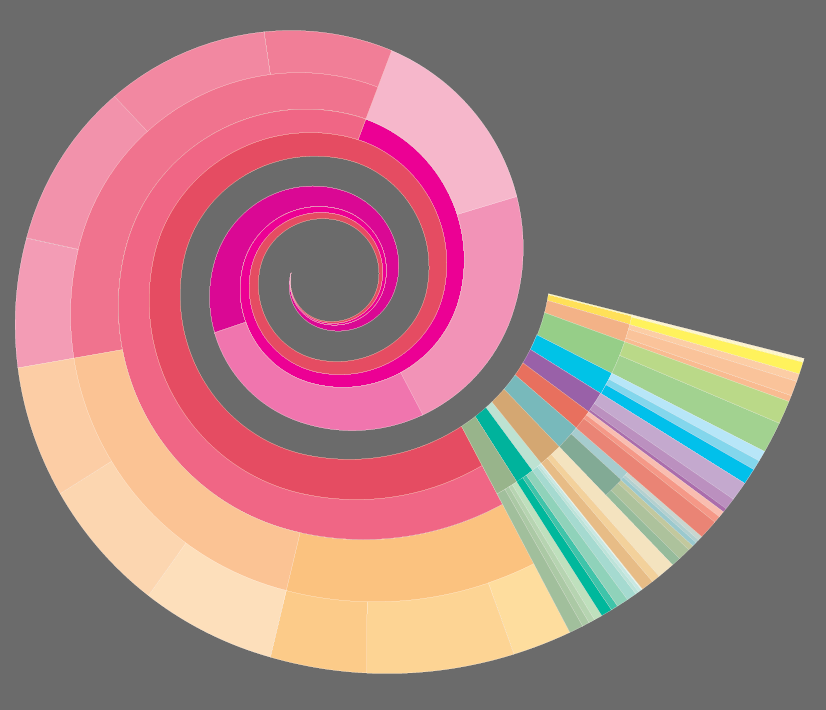
I do not read Italian, but I can certainly appreciate these wonderful multivariate visualisations. Valerio Pellegrini made this gorgeous visual representation of Italian Wikipedia use for 2013. Months are distributed clockwise with Italian initial for each month. It has three layers of information and data: the inner level; overall top edits, the second it is ...
Tree of life – custom drawing
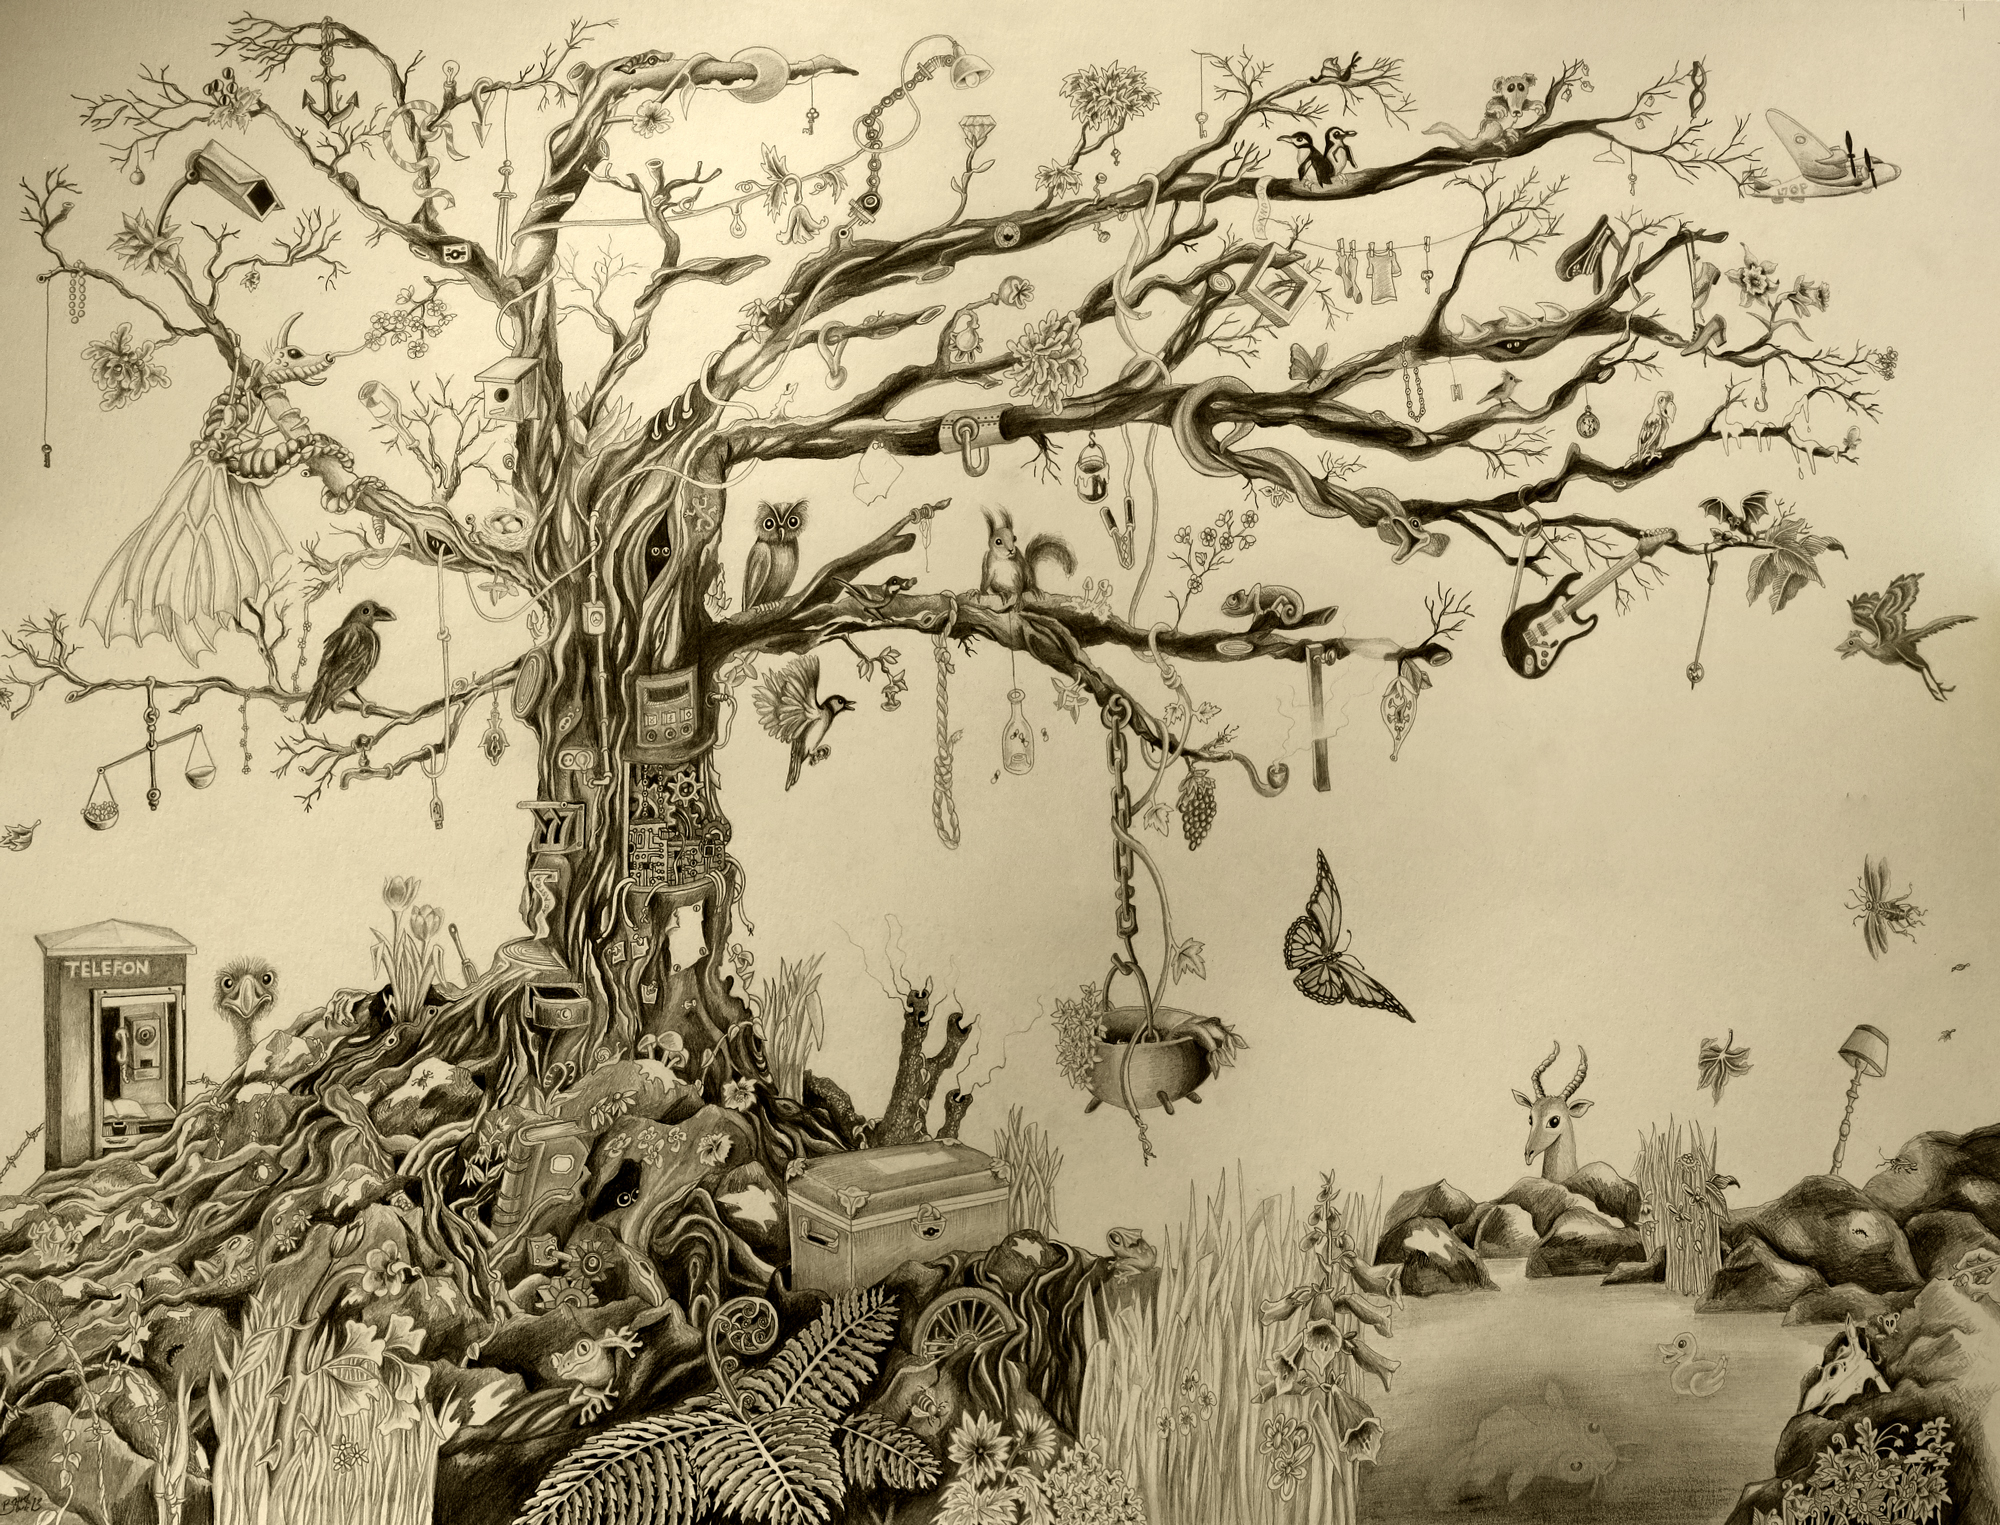
Tree of life – custom drawing: This is the third post in the series of my custom drawings. This time, it was a custom "tree of life" for my sister. She had a whole spare wall in the cabin up in the mountains... Again, as in all custom drawings I do, there are some elements ...
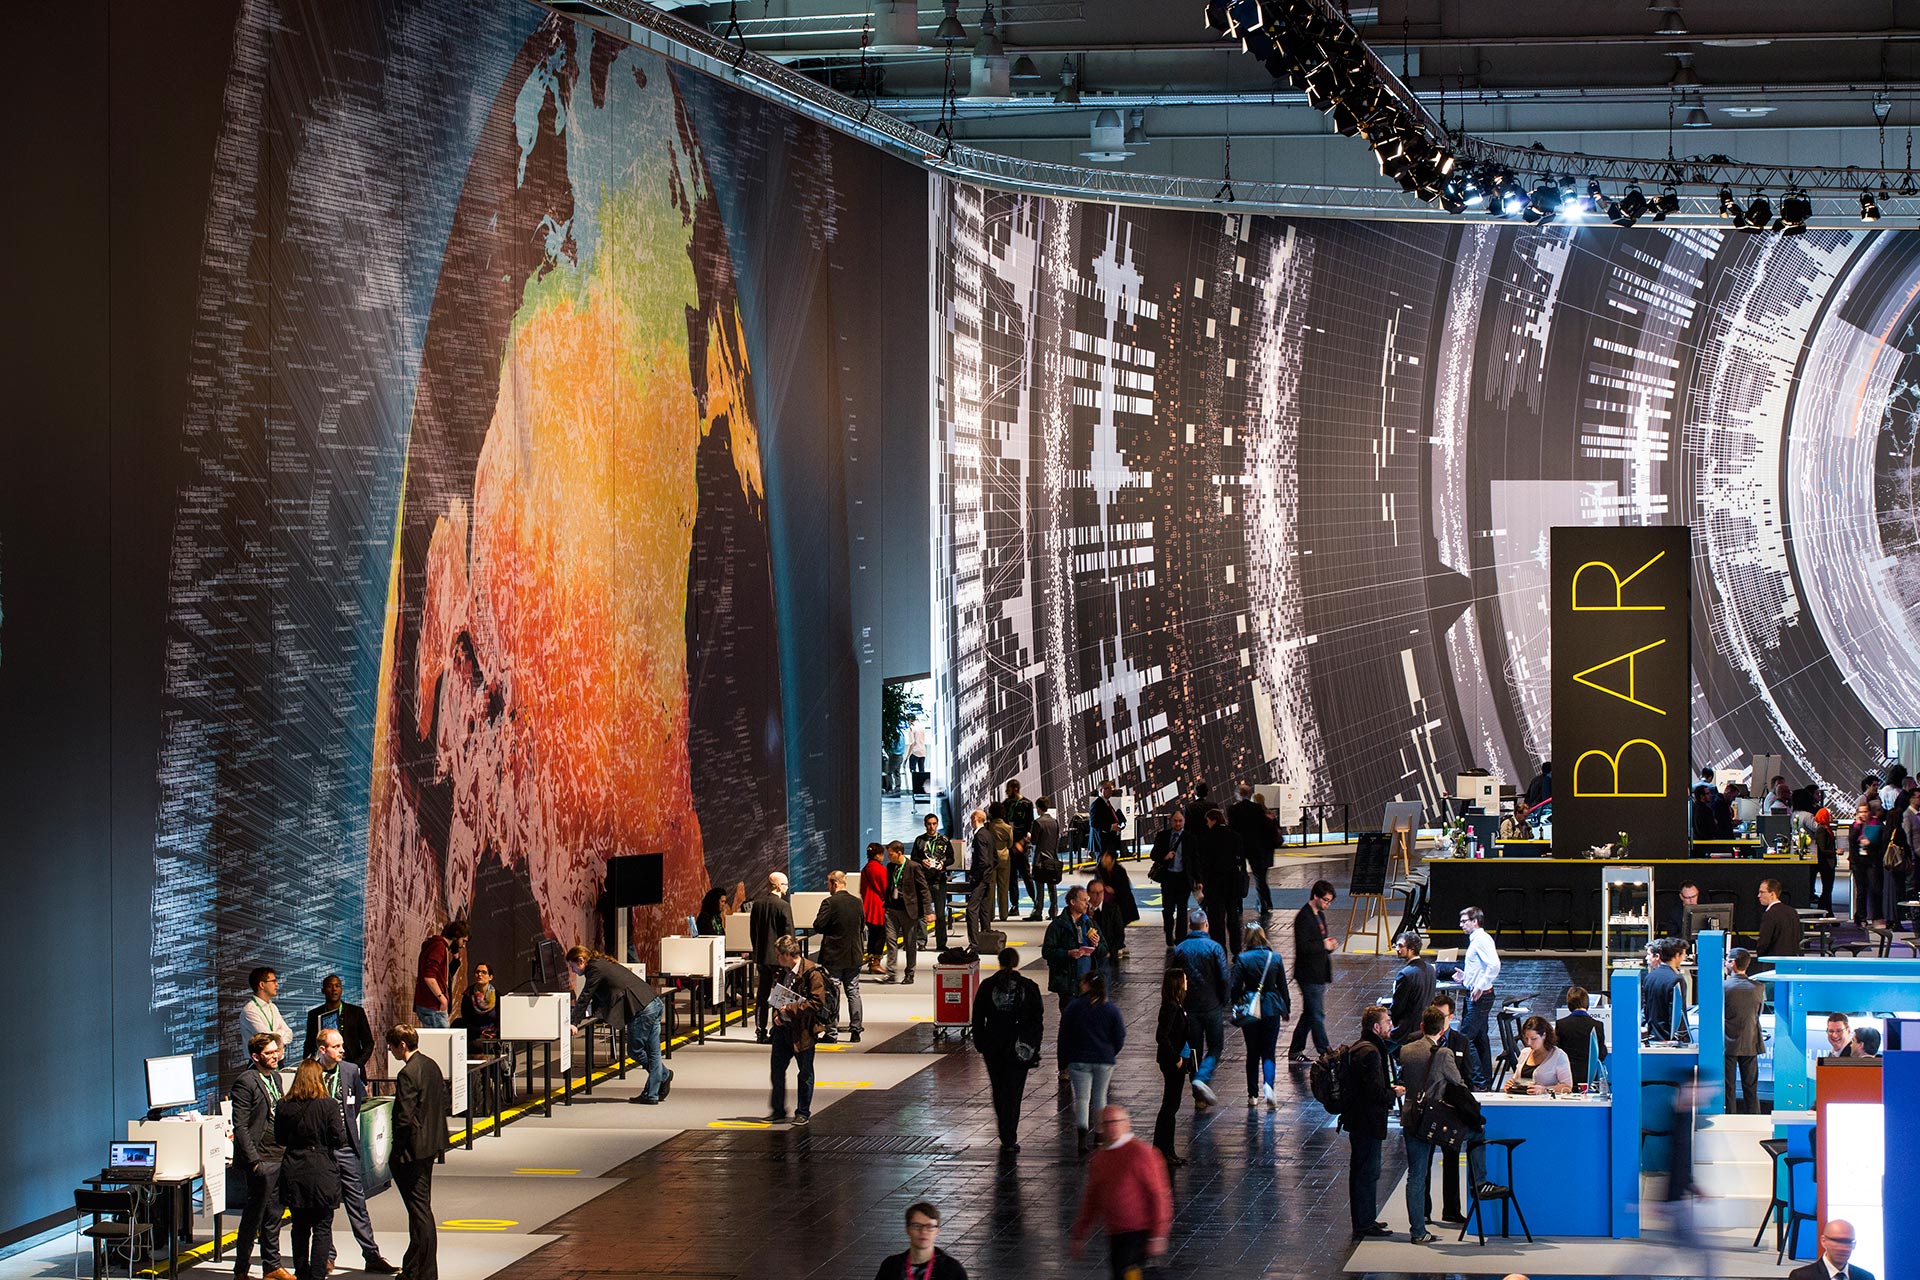
Massive scale, breathtaking data-driven visualisation at CeBit 2014
I sometimes come across data visualisations that takes my breath away. This is one. Created by the design house Kram/Weisshaar for the CeBit 2014 computer expo in Hannover. Wish I was there. It is of course the sheer size that makes an impact, but the visualisations themselves are amazing, the amount of data accessed mindblowing, ...

Visualising data, telling stories
Telling stories that can only be seen. Data visualisations can be extraordinarily beautiful. Here are but a few tools. gephi Open-source desktop application, primarily a network visualisation tool, but with plugins galore for space-time extensions. Gapminder Beautiful, multivariate statistics. See this phenomenal TED presentation by Hans Rosling - love that guy Google charts Not surprising, ...
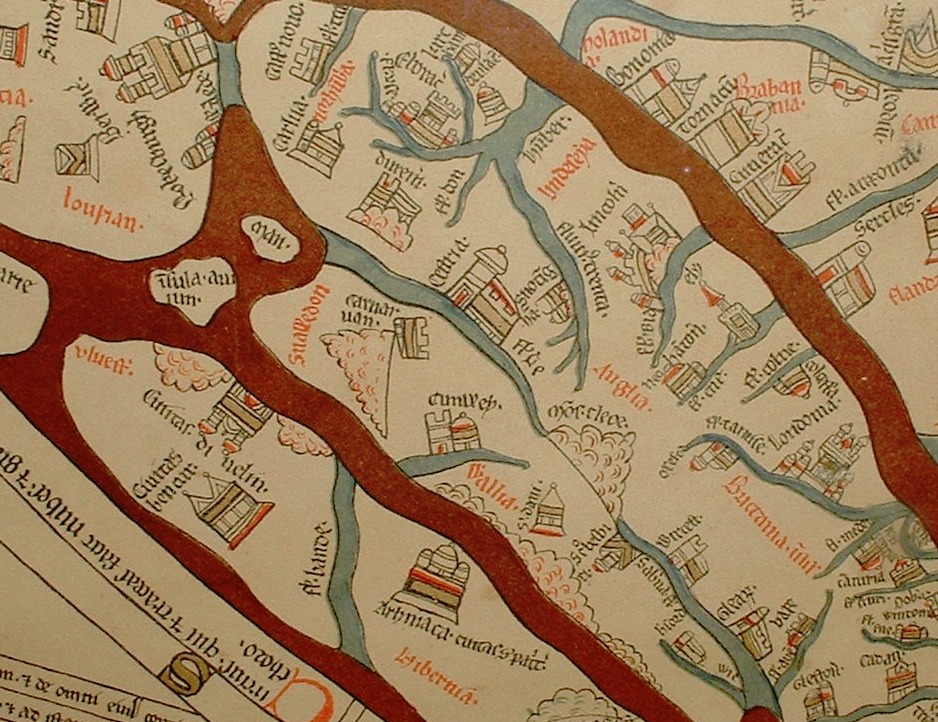
Maps: the time and space of the Hereford cloth of the world
Maps: the time and space of the Hereford cloth of the world The Hereford Mappa Mundi is one of the oldest know, complex map of the world (Mappa = cloth Mundi = world). It dates from about 1285, and are found in the Hereford cathedral. It depicts 420 towns, 15 Biblical events, 33 animals and ...
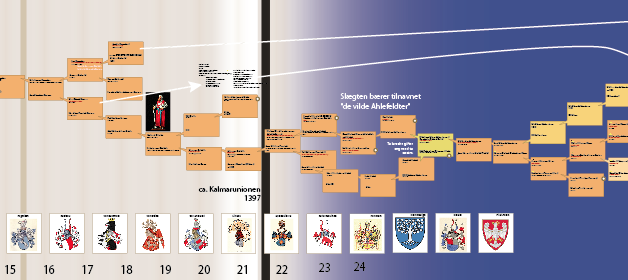
Multivariable visualisation: tracing 40 generations
A while ago, on a whim, i did some digging into my grandmothers family tree. I found more than I bargained for, as described in the post Noble genealogy. And I decided to make a family tree... A family tree of more then five generations soon gets complicated and it becomes impossible to keep track ...

“Next station! Pituitary Gland!”
Over at http://rangelmd.com/ there is this genius post: Human anatomy as subway map ...
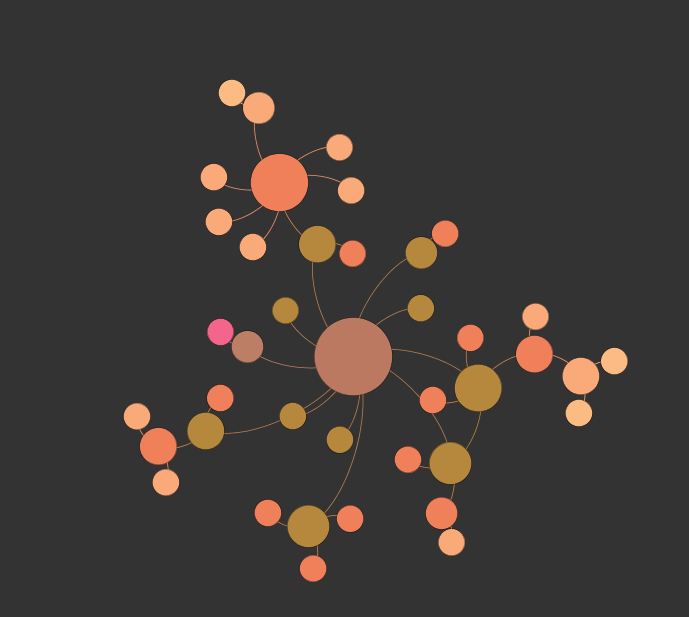
Life network
Take the things that are interesting, and see if you can connect the dots. This is made in Gephi, an open-source network visualisation tool. This will eventually be an interactive browser for my other blog ...

John Maeda: skill in the digital age
Skill in the digital age is confused with mastery of digital tools, masking the importance of understanding materials and mastering the elements of form ...
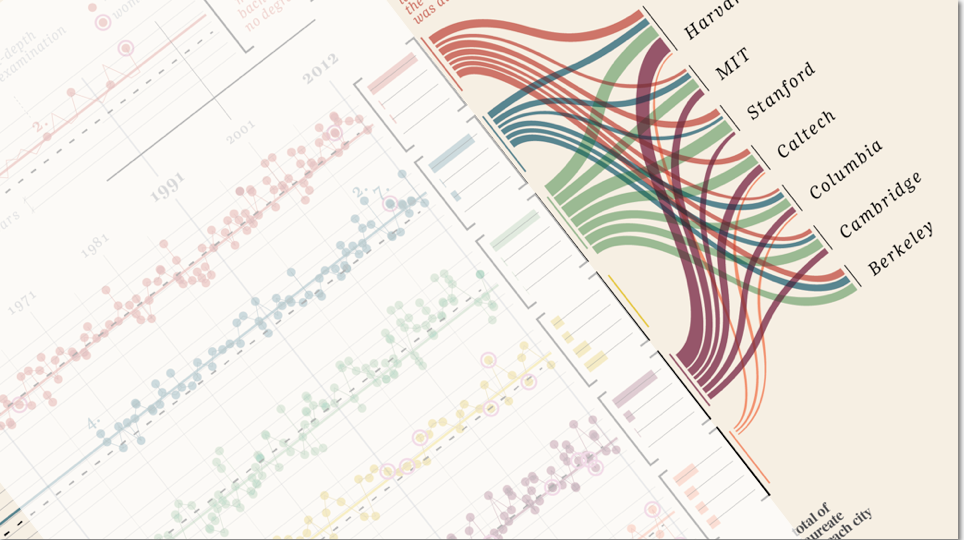
“Design is where science and art break even”
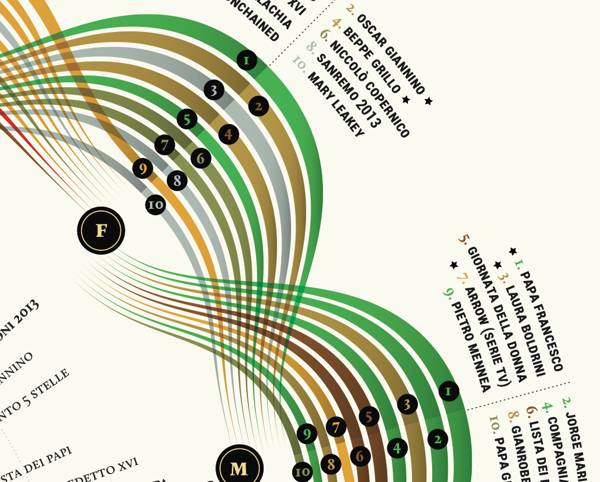
Once in a while I come across some images that takes my breath away, and make me intensely wish that I had thought about it myself. Art can of course do magic, but the combination of information and art, I feel, somehow takes both to a higher level. Giorgia Lupi Has made these amazing charts ...